A patient waits for a CBC result. A surgeon holds the OT slot. A TPA adjudicator needs the biochemistry panel before approving a discharge under CGHS. In every scenario, lab turnaround time is the metric that either builds trust or erodes it. Most lab managers know their average TAT. Very few can pinpoint the exact stage where the hours disappear.
How to reduce lab TAT? Map the workflow into three stages: pre-analytical (registration, collection, transport), analytical (instrument run, QC), and post-analytical (validation, reporting, dispatch). Fix each with barcode-linked collection, bidirectional LIS-instrument integration, rule-based auto-validation, and a real-time TAT dashboard. Pre-analytical delays typically account for more than half the total time lost.
What Is Lab Turnaround Time and Why It Matters
Lab TAT is the elapsed time from the moment a test is ordered to the moment a validated report reaches the clinician or patient. The definition sounds straightforward. In practice, labs measure it differently: some clock from sample collection, others from registration, and a few from specimen receipt at the analyser. That inconsistency is itself a problem, because you cannot fix what you are not measuring consistently.
For hospitals empanelled under Ayushman Bharat PM-JAY, CGHS, ESI, or state government health schemes, lab turnaround time directly affects bed occupancy. A delayed creatinine result holds a nephrology patient for one extra day. At ₹4,000–₹9,000 per occupied bed per day in a tier-2 hospital, that one-day delay carries a calculable rupee cost. For standalone diagnostic labs, slow TAT is a referral killer: physicians route urgent samples to the faster competitor down the road without a second thought.
NABH standards require labs to define, monitor, and document TAT for critical tests as a mandatory quality indicator. Failing to produce that data earns a non-conformance at every assessment cycle. Getting turnaround time right is not only about speed; it is about having documented evidence to prove consistent performance over time.
Where Lab Time Is Lost: A Stage-by-Stage Map
A typical sample passes through at least seven hand-off points before a report prints. Each hand-off is a potential delay. The table below maps where the hours actually go in most Indian labs, from registration to final dispatch.
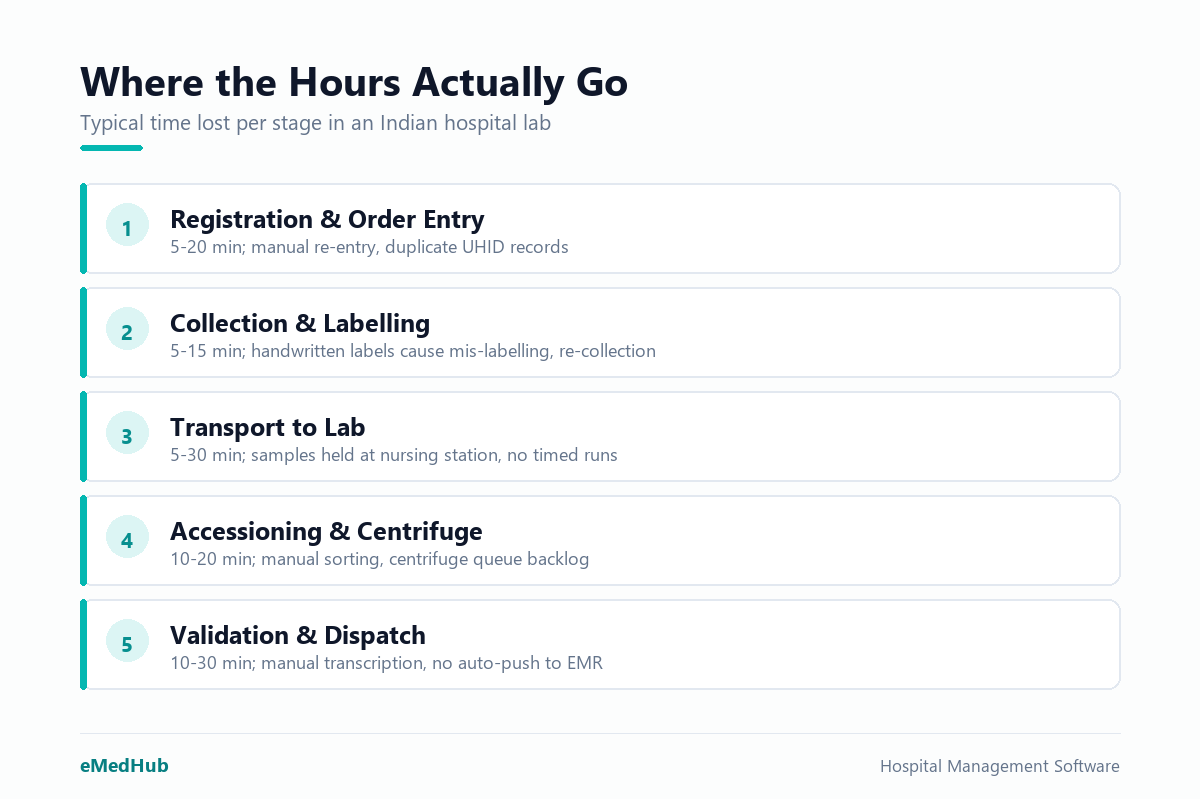
| Stage | Typical time lost | Common cause |
|---|---|---|
| Registration and order entry | 5–20 min | Manual data re-entry, duplicate patient records |
| Sample collection and labelling | 5–15 min | Handwritten labels, mis-labelling, re-collection |
| Transport to lab | 5–30 min | No timed collection runs, samples held at nursing station |
| Accessioning and centrifugation | 10–20 min | Manual sorting, centrifuge queue backlog |
| Instrument run and QC | Variable | QC failures, reagent stock-outs, STAT-routine mix-ups |
| Result entry and validation | 10–30 min | Manual transcription from analyser printout |
| Report dispatch | 5–20 min | Print queue, no auto-push to EMR or patient portal |
A routine CBC that the analyser completes in three minutes can take 90 minutes wall-clock time when every stage adds a 10-minute drag. Pre-analytical delays, covering stages one through four, account for the majority of wasted time in most labs. The analyser is rarely the bottleneck. The bottleneck is usually a handwritten label or a sample sitting in a rack waiting for someone to notice it.
Barcoding, LIS Integration, and Auto-Validation: The Fixes That Reduce Lab TAT
Once you know where the time goes, the fixes become specific. Three interventions deliver the largest, most consistent improvements in lab TAT. They build on each other, and implementing all three together produces results that no single change achieves alone.
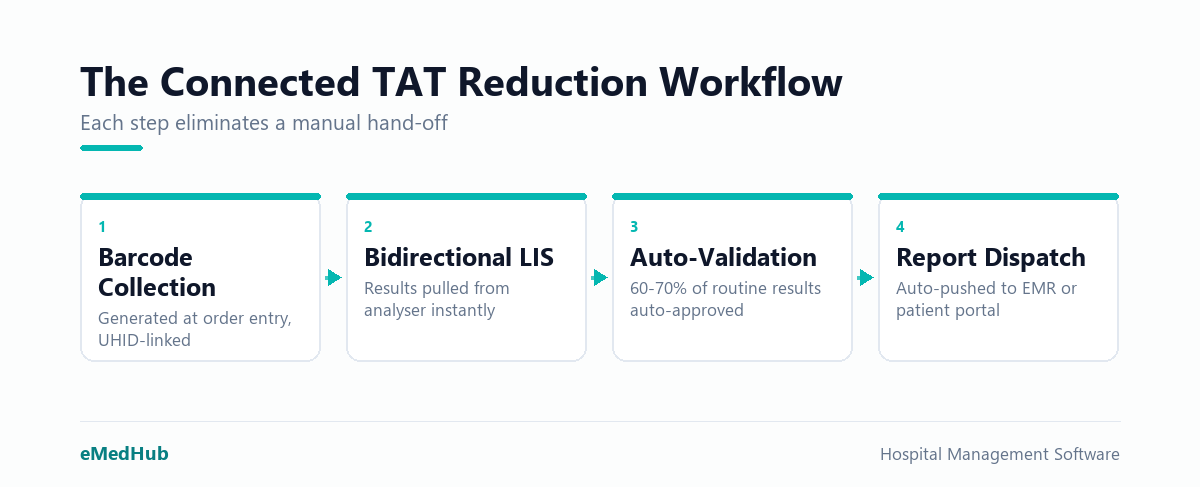
Barcode-Linked Sample Collection
Replace handwritten labels with system-generated barcodes at the point of order entry. The barcode carries the patient ID, test codes, specimen type, and priority flag. Every downstream scan at collection, at lab receipt, and at the analyser port timestamps the event automatically. You eliminate transcription errors and gain a full audit trail for NABH assessment. Labs that shift to barcode collection typically cut pre-analytical errors by 60–80% and reduce average TAT by 10–15 minutes per routine sample.
Bidirectional LIS-Instrument Integration
A unidirectional interface sends test orders to the analyser. A bidirectional interface also pulls results back into the LIS the moment a run completes. There is no printout, no manual transcription, and no transcription error. For a busy biochemistry lab processing 500 samples a day, eliminating manual result entry saves 3–5 staff-hours daily and removes a 10–30 minute delay from every batch. Bidirectional integration is the single highest-leverage fix in the post-analytical stage, and it should be non-negotiable when you select an LIS.
Rule-Based Auto-Validation
Not every result needs a technologist to approve it manually. Configure auto-validation rules: if haemoglobin falls between 8 and 18 g/dL with no delta-check flag and no instrument alarm, validate and dispatch automatically. Critical values, panic results, and delta-check failures route to a technologist for review. A well-configured setup typically passes 60–70% of routine results directly to dispatch, removing the manual queue from normal results entirely and cutting post-analytical TAT to near zero for those samples.
These three fixes work best when they are part of a single connected workflow. Your diagnostic lab management software must support barcode generation, bidirectional instrument interfaces, and auto-validation natively, not as separate modules that require a different login or a manual file export between steps.
TAT Reporting: Measuring What You Want to Improve
A TAT dashboard converts raw lab turnaround time data into operational decisions. Without it, you are managing the lab on intuition. With it, you know which shift, which test category, and which collection point is responsible for the most breaches. A useful TAT report must cover the following:
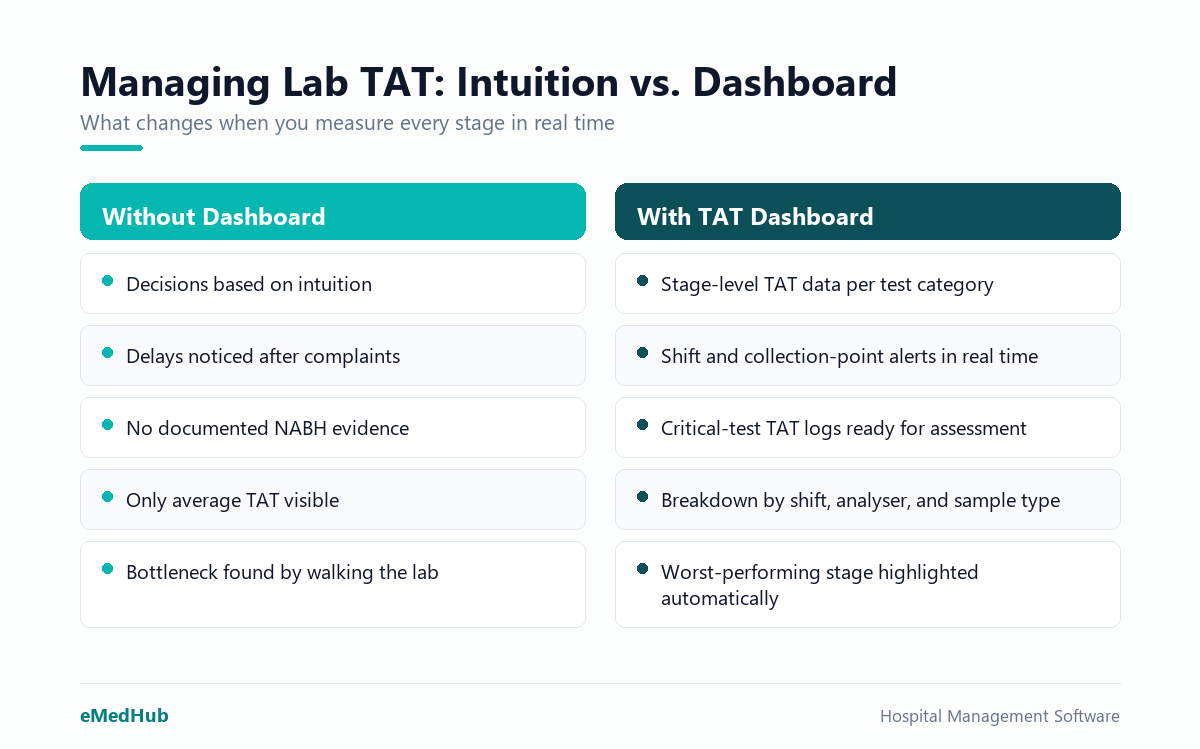
- Average and 90th-percentile TAT broken down by test type, department, and shift
- Breach rate: the percentage of samples that exceeded your defined TAT threshold
- Stage-level breakdown so delays in collection, transport, and validation are visible separately
- Critical value TAT as a standalone indicator, required by NABH and accreditation assessors
- Week-on-week trend lines so you can confirm whether interventions are actually working
Set internal targets before benchmarking against external labs. A reasonable starting point for a 100-bed hospital: 60-minute TAT for routine haematology, 90-minute for biochemistry panels, and 30-minute for ICU STAT requests measured from the moment of collection. Once you have two weeks of baseline data, the worst-performing shift and test type will be obvious. Start there.
Produce a daily TAT breach report and share it with the lab in-charge every morning. When staff see the number each day, behaviour changes. Without the report, you are asking people to improve a metric they cannot see. For multi-branch diagnostic chains, TAT reporting must aggregate across all sites so the operations head has a single consolidated view rather than a folder of emailed spreadsheets that arrive at different times.
How eMedHub Supports Lab TAT Reduction
eMedHub's LIS module connects registration, sample collection, instrument interfaces, and report dispatch in one continuous workflow. Barcodes are generated at order entry. Bidirectional HL7 interfaces support the common analyser brands used in Indian hospital and path labs. Auto-validation rules are configurable by the lab in-charge without a vendor call. Real-time TAT dashboards display breach alerts the moment a sample crosses its threshold, with notifications pushed to the lab in-charge by SMS or mobile app.
Because eMedHub is an integrated hospital information system, lab results flow automatically to the IPD doctor's screen, the patient portal, and the TPA claim file. There is no separate login and no manual transfer. Discharge delays caused by a missing report become an exception rather than a daily occurrence.
If you want to see how your lab's specific workflow maps onto the system, book a demo of eMedHub's diagnostic lab management software and walk through a live TAT configuration.
Frequently asked questions
What is a good TAT benchmark for a hospital lab in India?
A practical starting point: routine haematology (CBC) under 60 minutes from collection, routine biochemistry under 90 minutes, and ICU STAT tests under 30 minutes. These are internal targets, not regulatory mandates. NABH requires you to define your own thresholds and monitor adherence. Once you have two weeks of baseline data, tighten the targets progressively based on what the numbers show.
What causes the most delays in lab turnaround time?
Pre-analytical delays, covering registration, sample collection, labelling, and transport, account for over half of total TAT loss in most Indian labs. Handwritten labels, samples waiting at nursing stations, and manual order entry are the three biggest culprits. Fixing the pre-analytical stage consistently delivers faster improvement than optimising the analyser run or the QC process.
How does barcode labelling reduce lab TAT?
Barcode labelling eliminates handwritten tube labels, which are a primary source of mis-labelling and re-collection delays. When a barcode is generated at order entry and scanned at each hand-off point, every stage is timestamped automatically. The result is fewer recollections, no manual re-entry errors, and a real-time view of exactly where every sample sits in the workflow.
Does auto-validation compromise lab report accuracy?
No, when configured correctly. Auto-validation applies only to results within predefined acceptable ranges with no delta-check or instrument flags. Any outlier, critical value, or result beyond the delta threshold routes automatically to a technologist for review. Most labs pass 60–70% of routine results through auto-validation and reserve manual review for cases that genuinely need it.
How do I track lab TAT across multiple branches of a diagnostic chain?
You need a centralised LIS or hospital information system where all branches log to a single database. A branch-level dashboard gives the local lab in-charge their own view; a central dashboard gives the operations head an aggregate view with drill-down by branch, test type, and shift. Without a unified system, you are relying on emailed spreadsheets, which introduces unavoidable reporting lag and human error.